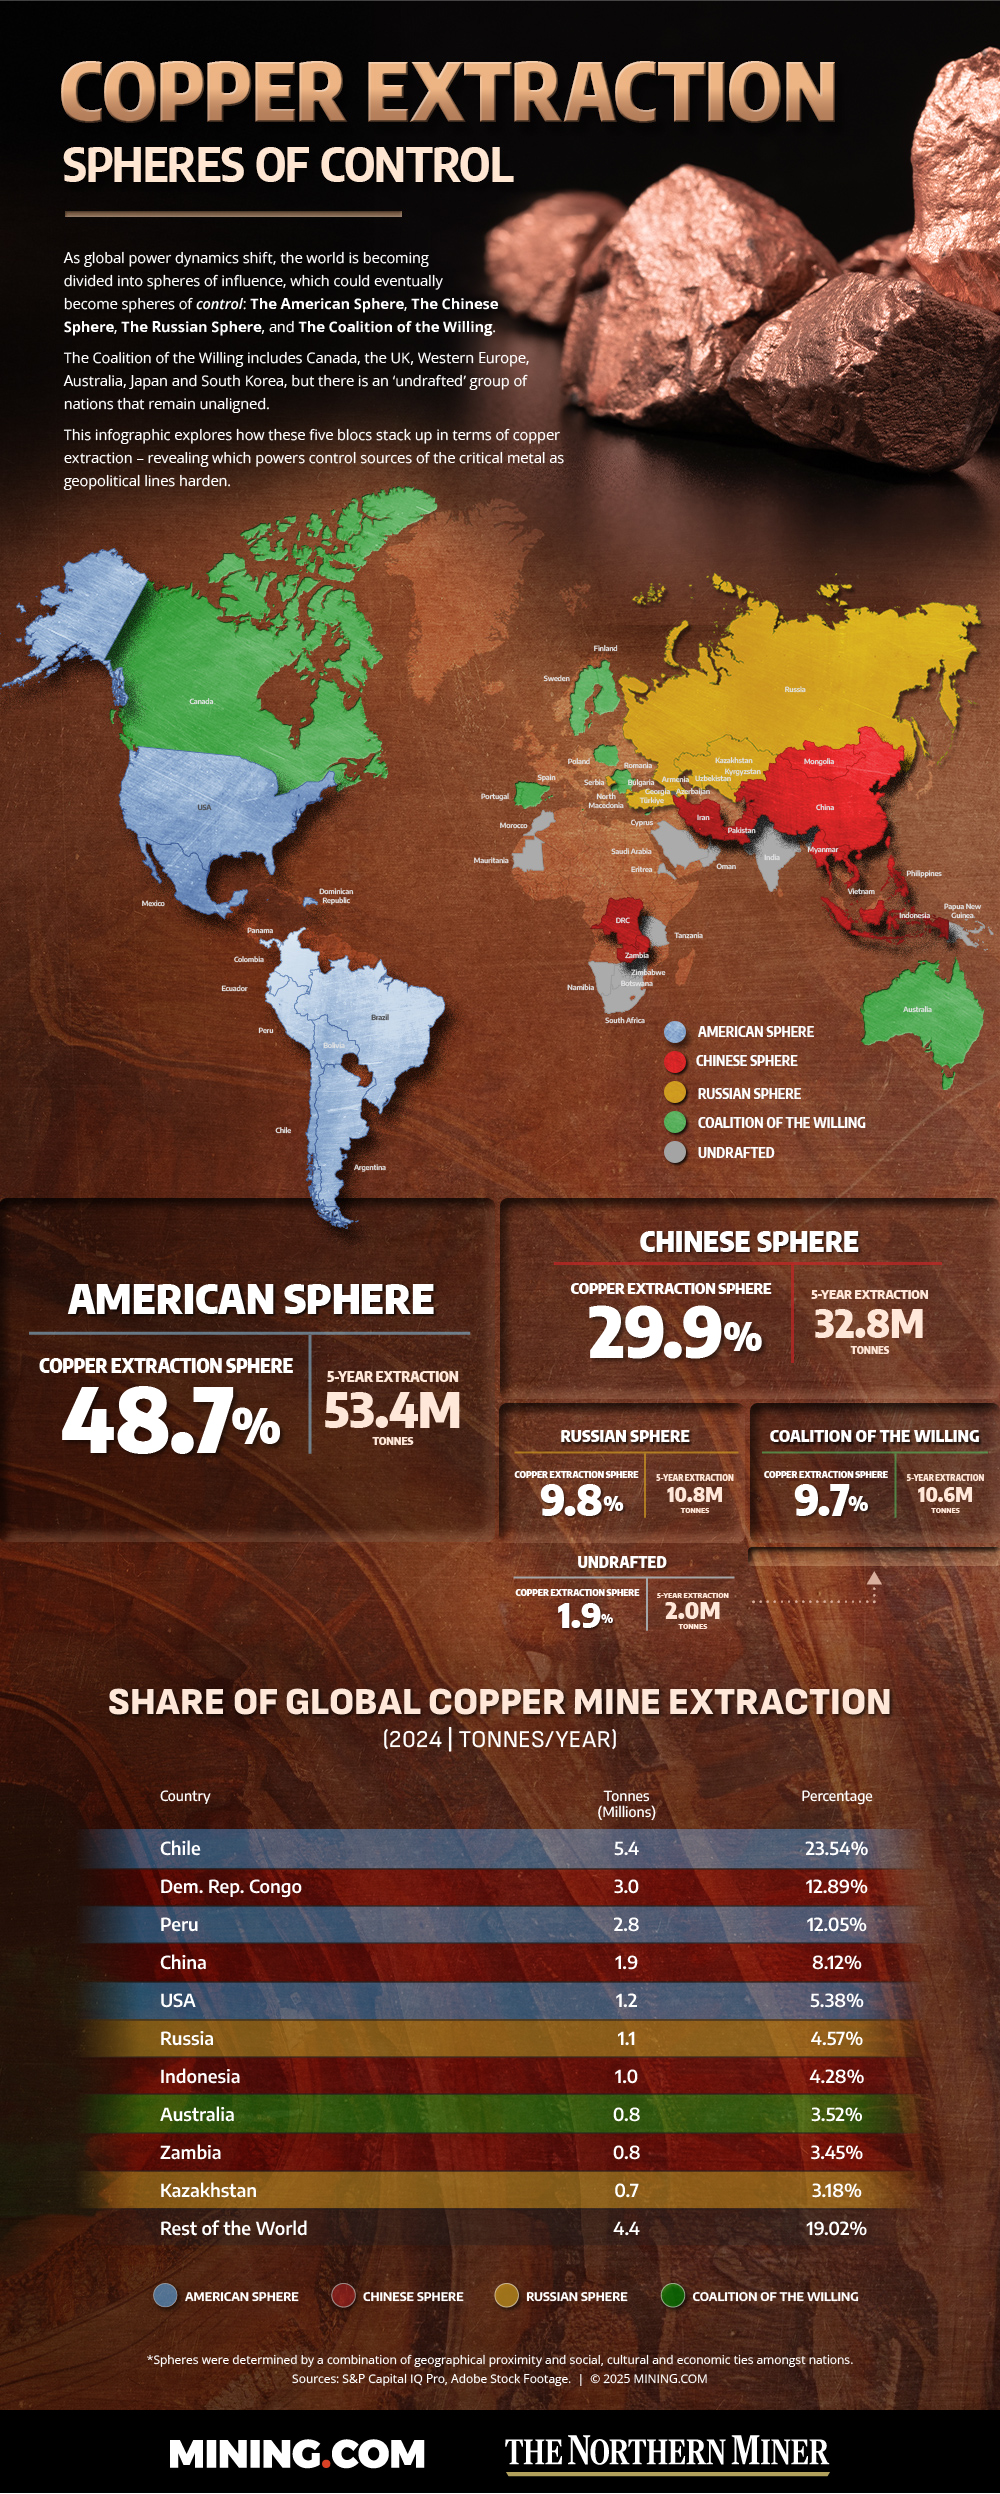
MINING.COM and The Northern Miner mapped global copper production through a geopolitical lens, dividing the world into five “spheres of control”: American, Chinese, Russian, Coalition of the Willing, and Undrafted.
These groupings reflect geographic, social, cultural, and economic ties—and possible alignments in a more polarized world.
America still ahead
The American Sphere leads with 48.7% of global copper output over the past five years, followed by the Chinese Sphere at 29.9%.
The Russian Sphere and Coalition of the Willing each account for just under 10%, while 1.9% remains undrafted.
The bottom panel ranks top-producing countries, led by Chile, the DRC, and Peru.
(By: Anthony Vaccaro; Files from: Ali Ravaghi; Creative: James Alafriz)


Be the first to comment on "Infographic: Copper spheres of control"